Process Analytics
EventConductor ships built-in process analytics, computed on demand from the engine’s own repositories. There is nothing to deploy or configure: the same numbers are available in every deployment mode (embedded + memory, embedded + JPA, kafka + JPA) and through three surfaces — the UI, the MCP server, and the Java API.
Per workflow definition and time window, the engine aggregates:
- Instance counts by status (
PENDING,RUNNING,COMPLETED,CANCELLED,ERROR) - Completion / error / cancellation rates
- Throughput over time — processes created and finished per day
- Process duration — average and p95 over finished instances
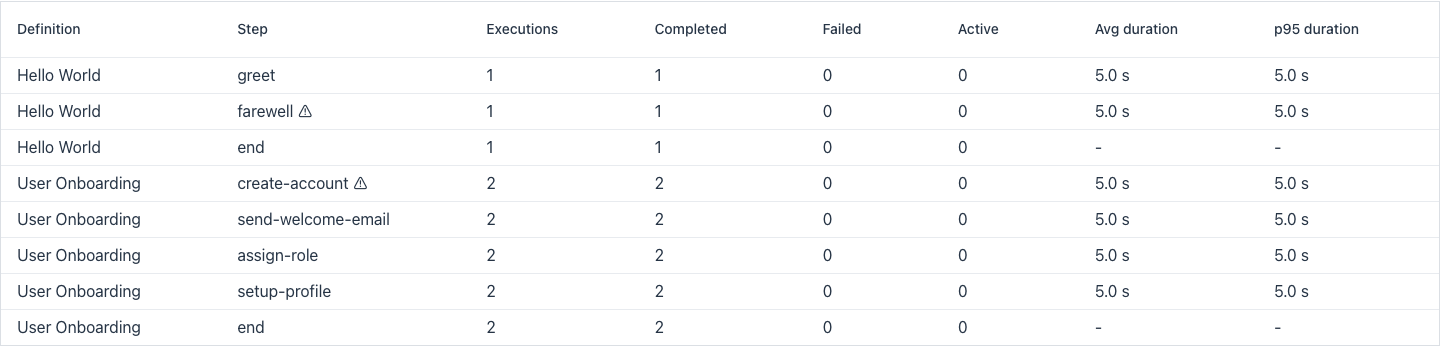
- Per-step durations — average and p95 per step, with executions, failures and instances currently waiting; the step with the highest average duration is flagged as the bottleneck
Scope (an honest note)
Section titled “Scope (an honest note)”This is a pragmatic, built-in analytics layer — per-definition operational metrics computed live from the process and step-execution stores — not a BI suite like Camunda Optimize. There are no custom reports, no dashboards builder, and no long-term data warehouse: history lives as long as your process instances do. For fleet-level dashboards and alerting, combine it with the Prometheus engine metrics.
The Analytics page
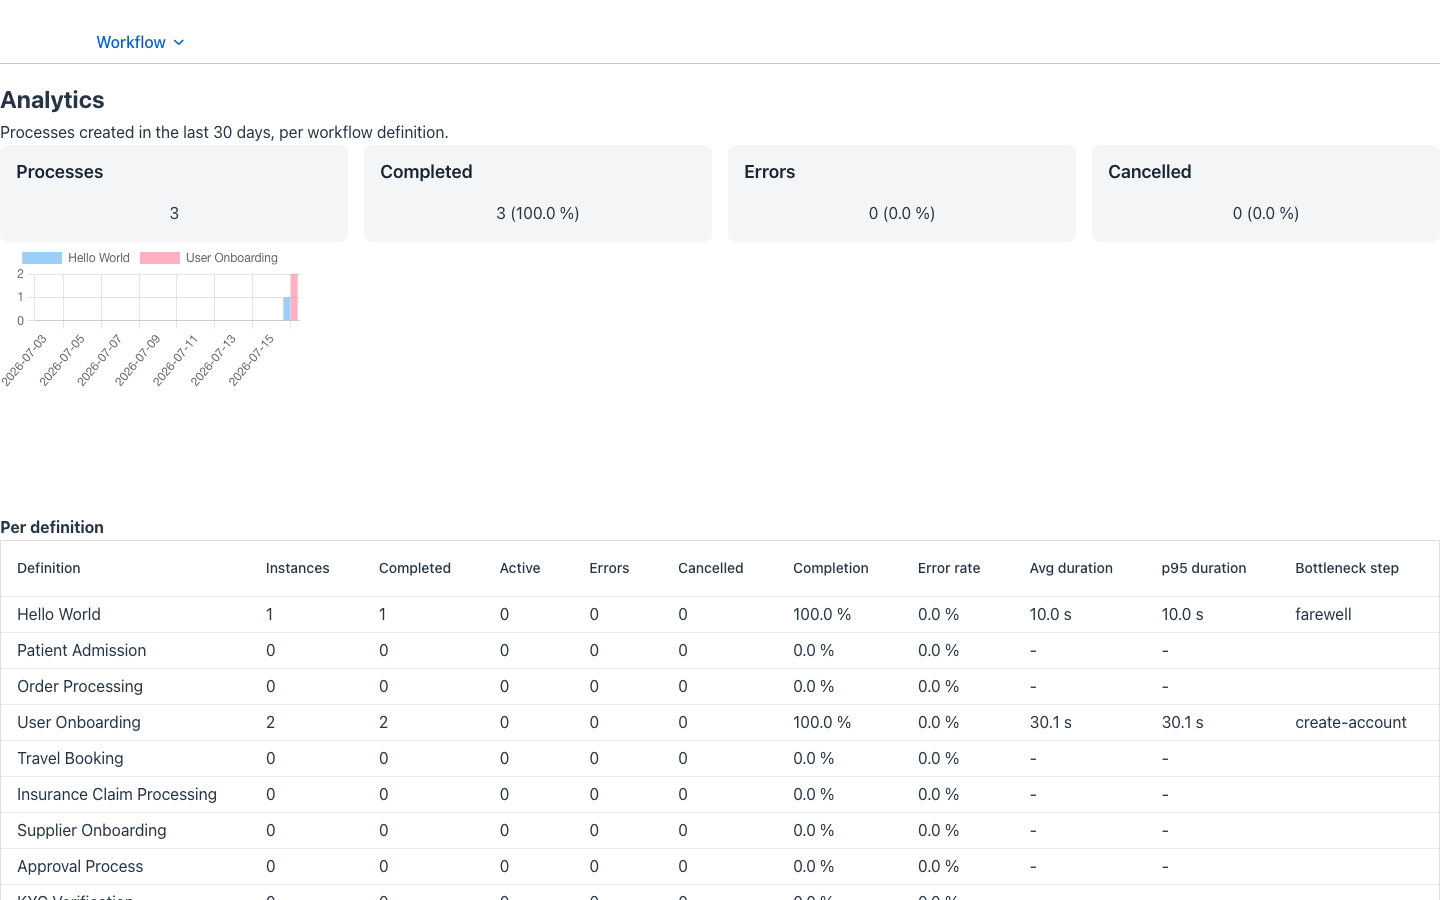
Section titled “The Analytics page”The workflow UI has an Analytics entry in the menu, under /_workflow-admin since 2.12.0 (it was under /_workflow before the operations / administration split; the route, /workflow/analytics, is the same either way). It shows, for the last 30 days: KPI cards (processes, completed, errors, cancelled), a processes-per-day chart and a per-definition table (counts, rates, average/p95 duration, bottleneck step):
Below it, a per-step table breaks durations down per step, with the slowest step of each definition flagged (⚠):
Asking the AI agent
Section titled “Asking the AI agent”The orchestrator MCP server exposes two analytics tools, so an agent connected to it (see AI Integration) can answer questions like “where do onboarding processes get stuck?”:
getWorkflowAnalytics(workflowDefinitionIdOrName, lastDays)— the full report described above. Leave the definition empty for all definitions;lastDaysdefaults to 30,0means all time.findBottleneck(workflowDefinitionIdOrName, lastDays)— a focused answer: the slowest step (by average duration), steps with instances currently waiting or running, and steps with failures.
> Where do onboarding processes get stuck?
The bottleneck of "Onboarding" is the step 'provision' (avg 60 s, p95 112 s).3 instances are currently waiting on 'approve-contract', and 'bill' has 2failed executions in the last 30 days.
The Java API
Section titled “The Java API”ProcessAnalyticsService (in io.mateu.workflow.application.services) is a regular Spring bean you can inject anywhere the engine runs — including embedded mode:
@AutowiredProcessAnalyticsService analytics;
var report = analytics        .analyze("onboarding", ProcessAnalyticsService.TimeWindow.lastDays(30))        .orElseThrow();
report.completionRatePct();     // e.g. 92.5report.processDuration().p95(); // java.time.Durationreport.bottleneckStepId();      // e.g. "provision"
analyzeAll(window) returns the same report for every known definition. Definitions can be resolved by id or (case-insensitively) by name.
How durations are measured
Section titled “How durations are measured”- Process duration: from
started(falling back tocreated) untilfinished, over finished instances only. - Step duration: from
startedAtuntilfinishedAt. The engine stampsfinishedAtwhenever a step execution reaches a terminal status (COMPLETED,CANCELLED,ERROR,TIMEOUT). - p95 is nearest-rank over the measured samples.
- Steps executed before the
finishedAtfield existed (or currently in flight) are counted in the totals but excluded from duration stats. - The time window selects process instances by creation time; step stats cover the steps of those instances.
Analytics are computed on demand from ProcessRepository and StepExecutionRepository — with in-memory persistence they reflect the current JVM’s state; with JPA they reflect everything in the database.