8 · Debugging a workflow
BOOKING-3 did not finish booking: it is waiting for the guest, and one of its rooms failed. Why? Debugging a workflow is following the evidence the engine kept, from the outside in.
1. The graph says where
Section titled “1. The graph says where”Open the run, tab Diagram. The red badge is where something failed, and how much: rooms booked 2/3. Its log says what the policy did with the failure:
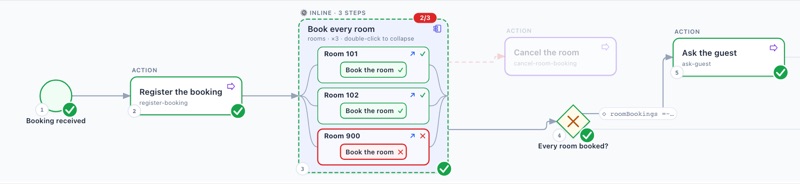
forEach on step rooms completed: 2 of 3 iterations completed, 1 failed (onIterationFailure continue).
So: one room failed, the policy kept the other two, and the flow went on to ask the guest — which is why the run is Running, waiting at Wait for the guest’s answer, not Error. (Had the guest answered cancel, the run would be Compensated — and Cancel the room would show 2/2.)
2. The Errors tab says what — up to a boundary
Section titled “2. The Errors tab says what — up to a boundary”
The parent lists what failed under it, by lane: each room ran as a child process of its own, and rooms · Room 900 ended ERROR because its create-room-booking step failed. The child’s own run has the whole story. Follow it: double-click the failed lane’s header (Room 900) to open that child run, or find it in the process list.
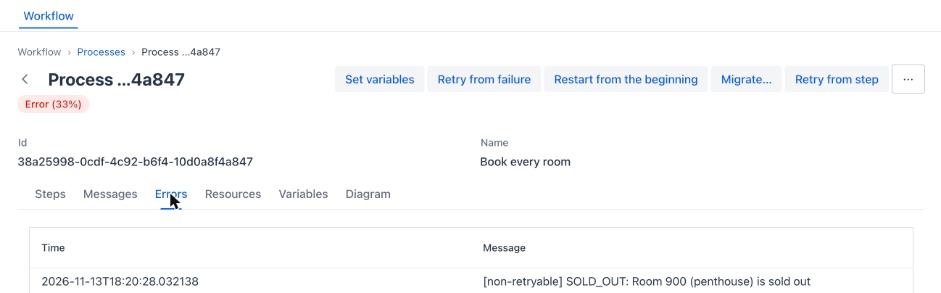
[non-retryable] SOLD_OUT: Room 900 (penthouse) is sold out — the worker’s own words: a business code, a reason, and the fact that it was final, so the engine did not retry it. This is why handlers should fail with a TaskFailure and a meaningful reason rather than an exception’s stack trace.
3. The Steps and Variables tabs say with what
Section titled “3. The Steps and Variables tabs say with what”Steps gives every step’s status and timing — including each retry’s attempt. Variables gives what the run carried when it failed: here the child’s room was {"number":"900","type":"penthouse"}. Most bugs are data the definition did not expect.
4. Copy state: the whole run, as JSON
Section titled “4. Copy state: the whole run, as JSON”Copy state puts the run on the clipboard — variables, steps and log in one document:
{ "id" : "104f0223-9290-40c8-80ad-e3774cf58cb6", "name" : "Book every room", "status" : "ERROR", "variables" : [ { "name" : "guest", "value" : "Bob" }, { "name" : "room", "value" : "{\"number\":\"900\",\"type\":\"penthouse\"}" } ], "steps" : [ { "stepId" : "start", "status" : "COMPLETED" }, { "stepId" : "create-room-booking", "status" : "ERROR" }, { "stepId" : "end", "status" : "CREATED" } ], "log" : [ { "type" : "Info", "message" : "START step Start passed through." }, { "type" : "Error", "message" : "[non-retryable] SOLD_OUT: Room 900 (penthouse) is sold out" } ]}(trimmed). Paste it into an issue, a chat with a colleague — or an AI assistant, which can read it far faster than you can read a log.
5. The logs say how
Section titled “5. The logs say how”The workers and the built-in steps log one line per call, without the process’s data. While building this workshop, the language model step of module 5 first failed, and the log said why at once:
LLM_CALL fake-model on assistant failed in 697 ms: LLM_404 (step classify-request)A 404 from the model’s endpoint: the connection’s base-url pointed at the wrong path. Fixed in configuration, the run retried, done. For a distributed deployment, the engine propagates trace context through every step and worker, so one booking is one trace — see Observability.
6. Reproduce it in a test
Section titled “6. Reproduce it in a test”The last step of debugging is making sure it never comes back. The variables from Copy state are the input of a test:
@Testvoid theRealHandlerRefusesThePenthouseAndTheGuestDecides(WorkflowTestRuntime runtime) {    var booking = runtime.start("rooms-booking-safe", "REAL-2",            Map.of("guest", "Fay", "rooms", Rooms.WITH_A_PENTHOUSE));    assertThat(booking).isWaitingAt("wait-for-guest").hasNoCompensations();
    runtime.sendMessage("guest-answer", "REAL-2", Map.of("answer", "cancel"));
    assertThat(booking).isCompensated().hasCompensated("rooms");}
It runs in milliseconds, in memory, with the real handlers — see Part 9. And when a test fails, it prints the run the same way the console shows it: Debugging a failing test.
Draft runs from the IDE
Section titled “Draft runs from the IDE”The VS Code extension can run a draft of a definition against an engine from the editor — before it is committed or deployed — and watch it in an execution view with the same graph, lanes and double-click navigation. It needs the engine to allow it (workflow.test-runs.enabled=true, a test environment: it calls real workers). It is not part of this workshop’s screenshots, which were taken without an IDE.